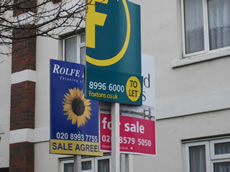
Acton Property Prices Reach New All-Time High
Demand for houses in W3 pushes values to record levels
The cost of a home in Acton has reached a new record level according to the latest sales figures for the area.
During the third quarter of this year the average price of a property changing hands in the W3 post code area was £397,818. This surpasses the previous highest level which was seen in the same three months two years ago.
The rise seems to be broad based with 159 properties changing hands in the period and no unusually high priced individual properties sold. A slow down in the sales of new build flats compared to the previous quarter has increased the proportion of houses sold but the rise cannot be seen as a statistical blip. House prices (as opposed to flat prices) are also at an all-time high.
The local property market's climb to these levels has been slow and steady rather than spectacular and the average price is still only 8.5% above what it was 5 years ago although it has risen by over 50% over 10 years.
The September data from Land Registry's flagship House Price Index shows an annual price increase nationally of 1.1 per cent which takes the average property value in England and Wales to £162,561.
The most up-to-date figures available show that during July 2012, the number of completed house sales in England and Wales decreased by 9 per cent to 56,509 compared with 62,303 in July 2011.
The number of properties sold in England and Wales for over £1 million in July 2012 increased by 13 per cent to 817 from 725 in July 2011.
The numbers below are subject to revision as is it usual that some properties are added late to the Land Registry's database.
In a forthcoming edition of the ActonW3.com newsletter there will be a complete listing of recent property sales in the area. To register to receive it .
Acton Property Prices - July to September 2012 |
||||||||
|---|---|---|---|---|---|---|---|---|
| Area | Semi-Det | Sales | Terraced | Sales | Flat/ Mais |
Sales | Total Ave | Total Sales |
| W3 0 | 484100 | 5 | 394500 | 3 | 322916 | 6 | 395821 | 14 |
| W3 6 | 638750 | 4 | 623457 | 13 | 252103 | 29 | 390672 | 46 |
| W3 7 | 537083 | 6 | 540108 | 15 | 294252 | 35 | 386124 | 56 |
| W3 8 | 0 | 0 | 432875 | 4 | 268339 | 14 | 304903 | 18 |
| W3 9 | 1009285 | 7 | 0 | 0 | 309136 | 18 | 505178 | 25 |
| Total | 693772 | 22 | 546330 | 35 | 283024 | 102 | 397818 | 159 |
| Change in Quarter | 18.2% | -12.0% | 1.8% | 25.0% | 0.0% | -20.3% | 9.2% | -12.2% |
| Change in year | 39.0% | 46.7% | 5.3% | 9.4% | 15.9% | 18.6% | 17.3% | 19.5% |
| Change in three years | 46.2% | 120.0% | 28.6% | 84.2% | 8.3% | 72.9% | 24.0% | 80.7% |
| Change in five years | 28.9% | -48.8% | 8.0% | -28.6% | 5.1% | -30.1% | 8.5% | -33.2% |
| Change in ten years | 83.7% | -69.4% | 68.6% | -50.0% | 58.5% | -31.1% | 51.2% | -45.2% |
| Acton Property Prices - April - June 2012 | ||||||||
|---|---|---|---|---|---|---|---|---|
| Area | Semi-Det | Sales | Terraced | Sales | Flat/Mais | Sales | Total Averages | Total Sales |
| W3 0 | 454500 | 6 | 498333 | 6 | 0 | 0 | 476417 | 12 |
| W3 6 | 489362 | 4 | 713166 | 9 | 248366 | 15 | 432194 | 28 |
| W3 7 | 536571 | 7 | 436666 | 6 | 287657 | 66 | 321030 | 79 |
| W3 8 | 603333 | 3 | 427642 | 7 | 252055 | 9 | 372210 | 19 |
| W3 9 | 884990 | 5 | 0 | 0 | 295981 | 38 | 364470 | 43 |
| Total | 587016 | 25 | 536499 | 28 | 283021 | 128 | 364221 | 181 |
| Change in Quarter | -2.7% | 47.1% | 14.5% | 7.7% | 7.7% | 75.3% | 1.5% | 56.0% |
| Change in year | 7.3% | 56.3% | 7.8% | -12.5% | 10.1% | 88.2% | 0.2% | 56.0% |
| Change in three years | 37.2% | 31.6% | 35.3% | 33.3% | 20.9% | 220.0% | 12.9% | 126.3% |
| Change in five years | 10.2% | -24.2% | 31.1% | -9.7% | 10.2% | -16.3% | 10.8% | -17.7% |
November 27, 2012
Related links
|
