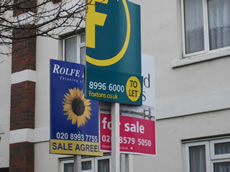
Demand Surges for Acton Flats
88% increase in number sold gives hope to developers
The market for flats in Acton, which has been moribund for some time, looks to have sprung to life in recent months.
A massive overhang of properties for sale had previously discouraged buyers but in the second quarter of this year 128 flats were sold, an 88% increase on the same period in 2011.
The figures from the Land Registry show that the average price of a property in Acton has been static over the last year at £364,221. This is below the average increase for London as a whole.
However, the increased proportion of flats sold during the period may be masking a rise in prices overall. The number of sales of higher priced houses grew less rapidly than those for flats.
Prices of semi-detached houses rose by 7.3% over the year, terraced houses were up by 7.8% and flats were up by 10%
London has been the best performing property market over the last year according to the Land Registry's House Price index. Prices were up by 6.3% in the year to June.
For England and Wales as a whole the House Price Index shows an annual price increase of 0.9% which takes the average property value in England and Wales to £161,777.
The numbers below are subject to revision as is it usual that some properties are added late to the Land Registry's database.
In a forthcoming edition of the ActonW3.com newsletter there will be a complete listing of recent property sales in the area. To register to receive it .
| Acton Property Prices - April - June 2012 | ||||||||
|---|---|---|---|---|---|---|---|---|
| Area | Semi-Det | Sales | Terraced | Sales | Flat/Mais | Sales | Total Averages | Total Sales |
| W3 0 | 454500 | 6 | 498333 | 6 | 0 | 0 | 476417 | 12 |
| W3 6 | 489362 | 4 | 713166 | 9 | 248366 | 15 | 432194 | 28 |
| W3 7 | 536571 | 7 | 436666 | 6 | 287657 | 66 | 321030 | 79 |
| W3 8 | 603333 | 3 | 427642 | 7 | 252055 | 9 | 372210 | 19 |
| W3 9 | 884990 | 5 | 0 | 0 | 295981 | 38 | 364470 | 43 |
| Total | 587016 | 25 | 536499 | 28 | 283021 | 128 | 364221 | 181 |
| Change in Quarter | -2.7% | 47.1% | 14.5% | 7.7% | 7.7% | 75.3% | 1.5% | 56.0% |
| Change in year | 7.3% | 56.3% | 7.8% | -12.5% | 10.1% | 88.2% | 0.2% | 56.0% |
| Change in three years | 37.2% | 31.6% | 35.3% | 33.3% | 20.9% | 220.0% | 12.9% | 126.3% |
| Change in five years | 10.2% | -24.2% | 31.1% | -9.7% | 10.2% | -16.3% | 10.8% | -17.7% |
| Acton Property Prices - January - March 2012 | ||||||||
|---|---|---|---|---|---|---|---|---|
| Area | Semi-Det | Sales | Terraced | Sales | Flat/Mais | Sales | Total Averages | Total Sales |
| W3 0 | 405400 | 5 | 487250 | 3 | 313237 | 4 | 395142 | 12 |
| W3 6 | 526500 | 4 | 514785 | 7 | 250312 | 16 | 359796 | 27 |
| W3 7 | 773333 | 3 | 393545 | 10 | 280260 | 19 | 361887 | 32 |
| W3 8 | 0 | 0 | 531000 | 6 | 240722 | 11 | 343173 | 17 |
| W3 9 | 759990 | 5 | 0 | 0 | 258771 | 23 | 348274 | 28 |
| Total | 603115 | 17 | 468719 | 26 | 262775 | 73 | 358812 | 116 |
| Change in Quarter | 0.3% | -29.2% | -13.8% | 73.3% | 14.5% | -14.1% | 5.7% | -6.5% |
| Change in year | 2.2% | -15.0% | -0.5% | 116.7% | 15.3% | 19.7% | 6.4% | 24.7% |
| Change in three years | 64.1% | 183.3% | -3.5% | 225.0% | -0.3% | 265.0% | 7.4% | 241.2% |
| Change in five years | 12.6% | -58.5% | 9.9% | -29.7% | 8.0% | -58.0% | 10.5% | -54.5% |
August 9, 2012
Related links
|
