Local Road Tops Charts For Nation's Most Congested Again
A406 between Chiswick Roundabout and Hanger Lane caused most delay
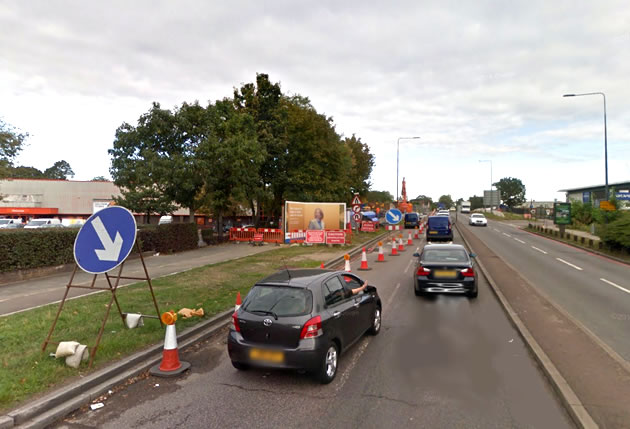 Gunnersbury Avenue north of Chiswick Roundabout. Picture: Google Streetview
A local road has been ranked the nation’s most congested for the third year running. A global survey published by transport consultant INRIX has shown that. over the course of a year. a motorist using the North Circular (A406) between Chiswick Roundabout and Hanger Lane in Ealing will be subject to 61 hours of delay, 12 hours more than the next most congested road in the country. On a delay basis the delays on the road amount to 15 minutes.
This is an increase of 5 hours on the delays seen on the same road last year which may have been caused by lane closures due to the Power Road Bridge work. However, 2019 is unlikely to see any improvements with some major work planned on the stretch of the road between Chiswick Roundabout and Popes Lane planned.
London was ranked as the worst city in the UK for time lost due to congestion with 277 hours per driver and it was the only city in the UK which ranked in the world’s top ten most congested cities globally ranking sixth.
Inrix Inc., publishes a Global Traffic Scorecard each year that identifies and ranks congestion and mobility trends in more than 200 cities across 38 countries.
In the U.K., the 2018 Traffic Scorecard analysed congestion and the severity of it in the top 20 urban areas. Drivers in the U.K. lost an average of 178 hours a year due to congestion, costing drivers U.K. drivers £7.9 billion in 2018, an average of £1,317 per driver.
20 Most Congested U.K. Roads in 2018 |
||||||
|---|---|---|---|---|---|---|
| Rank | City | Road Name | From | To | Daily Delay (Mins) | Yearly Delay (Hrs) |
| 1 | London | A406|North Circular Road | Chiswick Roundabout | Hanger Lane | 15 | 61 |
| 2 | London | A23 | Kennington | Thornton Road | 14 | 56 |
| 3 | London | Kingsway|Strand|Fleet|Cannon Street | Russell Square | Monument | 12 | 49 |
| 4 | Leeds | Leeds Road|Saltaire Road | Harrogate Road | Bradford Road | 11 | 44 |
| 5 | Birmingham | A34|Stratford Road | Highfield Road | Highgate Middleway | 11 | 44 |
| 6 | London | A406|North Circular Road | A1 | A10 | 11 | 43 |
| 7 | London | A2103 | Canary Warf | Tower of London | 11 | 43 |
| 8 | Birmingham | A34|Stratford Road | Highgate Middleway | Highfield Road | 11 | 42 |
| 9 | Leeds | Huddersfield Road|Leeds Road | Dewsbury | Huddersfield | 10 | 40 |
| 10 | Manchester | Bury New Road | Higher Broughton | M60 | 9 | 34 |
| 11 | Manchester | Bramhall Lane South | Bridge Lane | Stockport | 8 | 33 |
| 12 | Birmingham | Dudley Port | Black Country New Road | Dudley | 8 | 32 |
| 13 | Manchester | Chapel|Crescent|Broad Street | Victoria Bridge | M60 | 8 | 32 |
| 14 | Glasgow | Great Western Road | Kelvinside | Bearsden Road | 8 | 31 |
| 15 | Birmingham | Soho Hill|Birmingham Road | Icknield Street | M5 | 8 | 30 |
Source: Inrix
The report says that London drivers lost up to £1,680 per year due to congestion, followed by Edinburgh (£1,219), Manchester (£1,157) and Leicester (£1,145). Liverpool had the lowest cost of congestion among the U.K. cities studied at £878 per driver.
| 10 Most Congested Urban Areas in the U.K. | ||||||
|---|---|---|---|---|---|---|
| 2018 Impact Rank (2017) | Urban Area | Hours Lost in Congestion (Rank 2018) | Year Over Year Change | Intercity Last Mile-Travel Time (minutes) | Intercity Last-Mile Speed (MPH) | Cost of Congestion per Driver |
| 1 (1) | London | 227 (1) | 1% | 8 | 7 | £1,680 |
| 2 (2) | Birmingham | 134 (12) | -4% | 5 | 12 | £994 |
| 3 (3) | Glasgow | 99 (16) | 4% | 6 | 13 | £736 |
| 4 (7) | Manchester | 156 (4) | 2% | 6 | 10 | £1,157 |
| 5 (5) | Bristol | 149 (9) | 0% | 8 | 8 | £1,099 |
| 6 (4) | Edinburgh | 165 (3) | 10% | 8 | 7 | £1,219 |
| 7 (8) | Sheffield | 149 (8) | 1% | 6 | 10 | £1,101 |
| 8 (9) | Leicester | 155 (5) | -4% | 6 | 11 | £1,145 |
| 9 (10) | Leeds | 143 (10) | 6% | 5 | 12 | £1,057 |
| 10 (6) | Liverpool | 119 (13) | -16% | 6 | 9 | £878 |
Source Inrix
“Congestion costs Brits billions of pounds each year. Unaddressed, it will continue to have serious consequences for national and local economies, businesses and citizens in the years to come,” said Trevor Reed, transportation analyst at INRIX. “In order to avoid traffic congestion becoming a further drain on our economy, it is increasingly obvious that authorities need to adapt. With the help of new and innovative intelligent transportation solutions, we can begin to tackle the mobility issues we face today.”
At the global level, Moscow topped the list of the world’s most gridlocked cities (210 hours lost due to congestion) when weighting for population, followed by Istanbul, Bogota, Mexico City and São Paulo.
10 Most Congested Cities in the World in 2018 |
|||||
|---|---|---|---|---|---|
| 2018 Impact Rank (2017) | Urban Area | Country | Region | Hours Lost in Congestion (Rank 2018) | Year Over Year Change |
| 1 (1) | Moscow | Russia | Europe | 210 (10 ) | -12% |
| 2 (3) | Istanbul | Turkey | Europe | 157 (32 ) | 6% |
| 3 (2) | Bogota | Colombia | South America | 272 (1 ) | -5% |
| 4 (4) | Mexico City | Mexico | South America | 218 (9 ) | 3% |
| 5 (5) | São Paulo | Brazil | South America | 154 (39 ) | -1% |
| 6 (6) | London | U.K. | Europe | 227 (6 ) | 1% |
| 7 (8) | Rio de Janeiro | Brazil | South America | 199 (13 ) | 15% |
| 8 (7) | Boston, MA | United States | North America | 164 (25 ) | -6% |
| 9 (9) | Saint Petersburg | Russia | Europe | 200 (12 ) | -5% |
| 10 (13) | Rome | Italy | Europe | 254 (2 ) | 16% |
Commenting on the report, Glynn Barton, Director of Network Management at TfL, said: “We are taking bold action to reduce congestion and improve London’s poor air quality. This includes removing the Congestion Charge exemption for private hire vehicles and reducing the time taken to clear up unplanned incidents, ensuring that roadworks by utilities companies and others are better coordinated. We are also working with the freight industry to encourage more efficient deliveries across the capital.”
“To directly tackle poor air quality, we are ensuring that buses, taxis and private hire vehicles are as green as possible, alongside the introduction of the Ultra-Low Emission Zone this April. In delivering the Mayor’s ambitious plans for 80 per cent of all journeys to be made by public transport, walking or cycling by 2041, our plans will further help tackle congestion across London.”
RAC spokesman Rod Dennis said: “Last year UK drivers told us that they are actually becoming more, not less reliant on using their cars – with struggling public transport cited as one of the reasons.
“This is a serious concern when you consider the limited physical space in our cities and the growing pressures to move large numbers of people around to get to their places of work and leisure.”
February 12, 2019