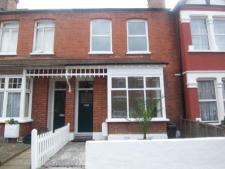
Ealing Property Prices Set New Records
'Family home shortage' and Crossrail driving up home values in area
The Ealing property market appears to have started the year strongly with high demand for both houses and flats according to local estate agents.
The average price so far this year in the W5 post code area is back over £500,000 according to the Land Registry's figures, up by 20.2% from last year. Over the same period, prices in W13 are up by 13.9% to £463,353.
This is not a record for the area overall but the underlying strength of the market is masked by the high proportion of flat sales during the first three months of the year. The number of flats sold in W5 was up by 84.2% compared with the same period last year. Flats prices in W5 have once again reached an all-time high averaging £356,390.
Donald Collins of Go View London reports an exceptional year for his firm in Ealing especially in terms of flat sales with buyers being attracted by rental yields and the capital growth potential being offered by the arrival of Crossrail. He says, "Over the last 3 months we have had hundreds of buy to let investors register with us, and many are prepared to pay a premium for the property matching their requirements."
If you look at the price of terraced houses in W5 in isolation they are averaging over £600,000 for the first time ever but, unlike with flats, the increase in values has not been accompanied by a surge in the number of transactions. In fact, in West Ealing the number of houses sold has fallen sharply. Business in West Ealing was comparatively quiet in recent months due to a lack of activity at the top end of the market rather than an across the board fall in prices.
Ray Upcraft, of Russell Collins estate agents said, "The property market in the Ealing area is as active as I can remember for many years. In particular the typical family houses in good school catchment areas in the £600,000-800,000 seem to have a virtual waiting list. For some reason those types of houses have not hit the market as frequently as usual this year which has also helped create a competitive edge''.
The March data from Land Registry's House Price Index shows that London remains the best performing property market in England and Wales. The average price of a home in the capital rose by 9.6% over the year to £374,568.
For the country as a whole prices only rose by 0.% which takes the average property value in England and Wales to £161,793. London has seen a rise in repossessions which were up by 28% in January 2013 compared with the same month in 2012.
In a forthcoming edition of the Ealingtoday.co.uk newsletter there will be a complete listing of recent property sales in the area.
To register to receive it click here.
| Ealing W5 Post Code Area Property Prices - January - March 2013 | ||||||||||
|---|---|---|---|---|---|---|---|---|---|---|
| Area | Detached | Sales | Semi-Det | Sales | Terraced | Sales | Flat/ Mais |
Sales | Total Ave. |
Total Sales |
| W5 1 | 0 | 0 | 684890 | 5 | 526666 | 6 | 279103 | 14 | 419676 | 25 |
| W5 2 | 1717000 | 5 | 0 | 0 | 712083 | 6 | 397555 | 58 | 520517 | 69 |
| W5 3 | 1202000 | 5 | 873990 | 5 | 0 | 0 | 321040 | 15 | 607822 | 25 |
| W5 4 | 0 | 0 | 0 | 0 | 522288 | 17 | 282583 | 9 | 439313 | 26 |
| W5 5 | 0 | 0 | 0 | 0 | 812096 | 7 | 344055 | 9 | 548823 | 16 |
| Total | 1459500 | 10 | 779440 | 10 | 611002 | 36 | 356390 | 105 | 508115 | 161 |
| Change in Quarter | 2.2% | 150.0% | 22.8% | 0.0% | 9.7% | -21.7% | 2.4% | -25.5% | 17.8% | -19.9% |
| Change in year | 14.3% | 150.0% | 24.8% | -37.5% | 30.4% | 0.0% | 28.7% | 84.2% | 20.2% | 42.5% |
| Change in three years | - | - | 26.7% | -52.4% | 29.6% | 38.5% | 21.7% | 81.0% | 26.5% | 53.3% |
| Change in five years | - | - | 30.3% | -50.0% | 34.2% | 50.0% | 9.2% | 41.9% | 23.2% | 33.1% |
| Ealing W13 Post Code Area Property Prices - January - March 2013 | ||||||||
|---|---|---|---|---|---|---|---|---|
| Area | Semi-Det | Sales | Terraced | Sales | Flat/ Mais |
Sales | Total Ave. | Total Sales |
| W13 0 | 504000 | 4 | 442285 | 7 | 271959 | 10 | 372933 | 21 |
| W13 8 | 778214 | 7 | 0 | 0 | 274875 | 12 | 460316 | 19 |
| W13 9 | 892500 | 6 | 521136 | 11 | 284214 | 7 | 544875 | 24 |
| Total | 754029 | 17 | 490472 | 18 | 276124 | 29 | 463353 | 64 |
| Change in Quarter | 7.8% | -39.3% | 2.2% | -50.0% | -2.5% | -34.1% | -8.8% | -43.9% |
| Change in Year | 11.2% | 30.8% | 7.3% | -37.9% | 1.6% | -21.6% | 13.9% | -19.0% |
| Change in Three Years | 20.4% | 88.9% | 21.3% | -47.1% | 17.6% | -14.7% | 30.3% | -16.9% |
| Change in Five Years | 19.9% | 13.3% | 10.3% | -50.0% | -2.9% | -48.2% | 19.9% | -40.2% |
Data in this report is subject to crown copyright protection.
May 15, 2013
Related links
|
