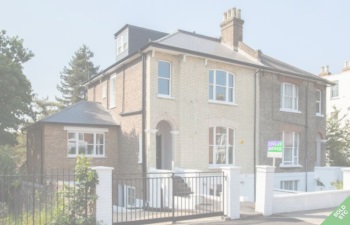
Acton House Sells For Record Price
Property increased in value by more than a million pounds in two years
A large semi-detached house close to Acton Central Station has broken previous records and been sold for £2,350,000.
The 6 bedroom property on East Churchfield Road marketed by Finlay Brewer was described as ' An imposing, fully refurbished, semi detached Victorian town house backing onto Acton Park.''
It had previously been sold in January 2012 for £1,275,000 meaning it's increased in value by over a million pounds. The latest sale was registered on 30th November 2013.
The property market in the fourth quarter in W3 is as buoyant as ever with prices now averaging out at an all time high of £460,032.
Latest figures for October to December from the Land Registry show that there were 193 sales in the W3 postcode area - mostly flats and maisonettes (126) 39 terraced, 26 semi-detached and 2 detached.
Prices in Acton have doubled over the last decade and show no sign of tailing off.
 The December data from Land Registry's House Price Index shows that London remains the best performing property market in England and Wales. The average price of a home in the capital rose by 11.2% over the year to £403,972.
For the country as a whole prices rose by 4.4% which takes the average property value in England and Wales to £167,353. Repossession volumes decreased by 28 per cent in July 2013 to 1,187 compared with 1,645 in July 2012.
The most up-to-date figures available show that during October 2013 the number of completed house sales in England & Wales increased by 21 per cent to 71,929 compared with 59,213 in October 2012. The number of properties sold in England and Wales for over £1 million in October 2013 increased by 40 per cent to 913 from 651 in October 2012.
In a forthcoming edition of the ActonW3.com newsletter there will be a complete listing of recent property sales in the area. To register to receive it .
| Acton Property Prices (October - December 2013) | ||||||||||
|---|---|---|---|---|---|---|---|---|---|---|
| Area | Detached | Sales | Semi-detached | Sales | Terraced | Sales | Flat/ mais |
Sales | Overall Ave | Overall Sales |
| W3 0 | - |
- |
598,357 |
7 |
600,990 |
4 |
327,493 |
4 |
526,829 |
15 |
| W3 6 | - |
- |
735,000 |
7 |
648,889 |
9 |
279,335 |
43 |
389,769 |
59 |
| W3 7 | 1,995,000 |
1 |
1,027,500 |
4 |
766,654 |
13 |
319,312 |
42 |
491,377 |
60 |
| W3 8 | - |
- |
810,000 |
1 |
610,342 |
13 |
337,247 |
18 |
462,966 |
32 |
| W3 9 | 430,000 |
1 |
1,126,750 |
7 |
277,508 |
19 |
503,330 |
27 |
||
| Total | 1,212,500 |
2 |
851,567 |
26 |
670,382 |
39 |
302,187 |
126 |
460,032 |
193 |
| Change in Quarter | 5.6% | -71.4% | 4.2% | 4.0% | 6.5% | -2.5% | -1.3% | -8.7% | 0.8% | -8.1% |
| Change in year | - | - | 27.4% | -21.2% | 21.9% | 39.3% | -3.5% | 6.8% | 10.7% | 7.8% |
| Change in three years | 34.0% | -33.3% | 44.3% | 13.0% | 43.5% | 69.6% | 18.3% | 44.8% | 27.0% | 41.9% |
| Change in five years | - | - | 109.4% | 116.7% | 76.3% | 333.3% | 19.4% | 270.6% | 49.6% | 250.9% |
| Change in ten years | - | - | 142.2% | -25.7% | 105.8% | -15.2% | 70.7% | -30.8% | 100.4% | -28.3% |
February 13, 2014
Related links
|
